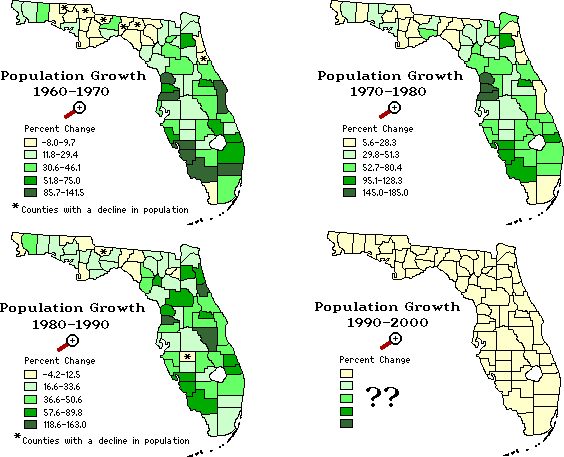
Labels:text | map | diagram | atlas OCR: Population Growth Population Growth 1960-1970 1970-1980 Percent Change Percent Change -8.0-9.7 5.6-28.3 11.8-29.4 29.8-51.3 30.6-46.1 52.7-80.4 51.8-75.0 95.1-128.3 85.7-141.5 145.0-185.0 * Counties with a decline in population Population Growth Population Growth 1980-1990 1990-2000 + Percent Change Percent Change -4.2-12.5 16.6-33.6 ?? 36.6-50.6 57.6-89.8 118.6-163.0 * Counties with a decline in population